An Vo

MSc Data Science for Economics at University of Liverpool, UK
Data Analyst Portfolio
👋 Hello! I am An Vo, a junior data analyst. I believe in the power of data to tell stories, solve problems, and drive business decisions. As someone early in my career, I’m excited to grow, take on new challenges, and keep improving every step of the way.
This portfolio is a compilation of data analysis projects I have completed for academic work and self-learning purposes. I look forward to connecting and learning with you!
- Email: vnhoaian791@gmail.com
- LinkedIn: linkedin.com/vnhoaian
Core Competencies
- Methodologies: Data Preprocessing, Exploratory Data Analysis, Statistical Analysis, Data Visualization, Regression Analysis, Time Series Modelling, Machine Learning
- Languages: R (tidyverse, ggplot2, tmap, forecast), Python (Pandas, Numpy, Scikit-Learn, Keras, Matplotlib), SQL (SQL Server), DAX
- Tools: RStudio, Jupyter Notebook, Azure Data Studio, Metabase, Snowflake, Power BI, Excel, Google Sheets
Certificates
- Business Intelligence Analysis - Marketing Intelligence - University of Liverpool
- Python for Data Science, AI & Development - IBM
- Data Analysis with Python - IBM
- SQL Advanced - HackerRank
- Process Data from Dirty to Clean - Google
- Analyze Data to Answer Questions - Google
Projects

[R Studio | quantmod, ggplot2, tseries, forecast, lmtest, FinTS, rugarch]
Investigated whether Bitcoin acted as a safe-haven asset like Gold during COVID-19. I used R to perform a time series analysis, building and interpreting ARMA-EGARCH models to compare the volatility dynamics of the two assets.
Investigated whether Bitcoin acted as a safe-haven asset like Gold during COVID-19. I used R to perform a time series analysis, building and interpreting ARMA-EGARCH models to compare the volatility dynamics of the two assets.

[Python | pandas, numpy, matplotlib, seaborn, sklearn]
Developed and compared four regression models (Ridge, Lasso, Random Forest, Neural Network) to identify factors influencing hourly wages. Ridge Regression emerged as the preferred model, highlighting experience, education, and gender as significant predictors.
Developed and compared four regression models (Ridge, Lasso, Random Forest, Neural Network) to identify factors influencing hourly wages. Ridge Regression emerged as the preferred model, highlighting experience, education, and gender as significant predictors.
[R Studio | readxl, tidyverse, ggplot2, sf, tseries, urca, forecast]
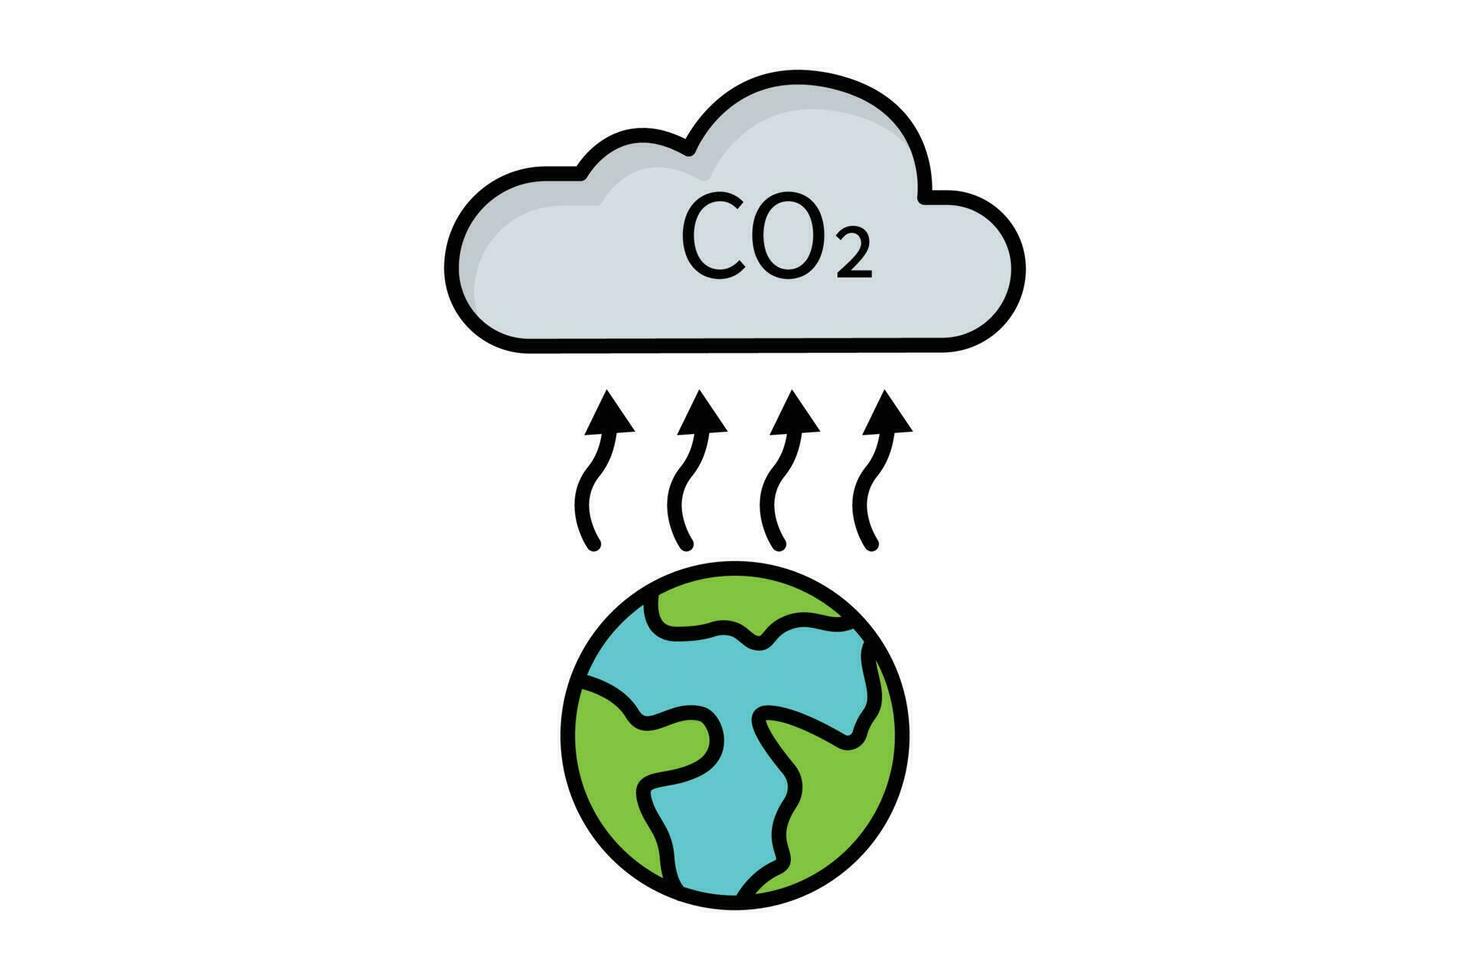
Analyzed 50 years of global CO₂ emissions from Our World in Data (1972–2022). Analysis revealed China and India as top current emitters, while the U.S. leads in historical and per capita emissions. A time series analysis also showed a 0.298% increase in CO₂ emissions associated with a 1% GDP increase.
Analyzed 50 years of global CO₂ emissions from Our World in Data (1972–2022). Analysis revealed China and India as top current emitters, while the U.S. leads in historical and per capita emissions. A time series analysis also showed a 0.298% increase in CO₂ emissions associated with a 1% GDP increase.

[R Studio | readxl, tidyverse, ggplot2, sf, tmap]
Analyzed Office for National Statistics data to examine housing affordability dynamics. Key findings show a significant decline in affordability since 2002, with house prices (8.3 times annual earnings in 2022) far outpacing wage growth. The analysis also highlights substantial regional disparities, with London being the least affordable.
Analyzed Office for National Statistics data to examine housing affordability dynamics. Key findings show a significant decline in affordability since 2002, with house prices (8.3 times annual earnings in 2022) far outpacing wage growth. The analysis also highlights substantial regional disparities, with London being the least affordable.

[Power BI] Built an interactive dashboard to analyze sales performance, profit margins, and customer behavior. Included RFM-based segmentation to identify Best Customers, Loyal, Hibernating, and Almost-Lost users. Enabled data-driven decisions through visual insights on regional, product-level, and time-based trends.

[Power BI, SQL] Developed a dashboard to track key COVID-19 metrics globally (confirmed cases, deaths, CFR) and by country, using data from Our World in Data. SQL was used for preprocessing.
Personal Research
- EKC Hypothesis: A Comparative Analysis of Production-Based and Consumption-Based Emissions Across Income Groups
Panel data econometric study examining the Environmental Kuznets Curve using fixed and random effects models.
📘 Read Full Paper (PDF)